
The UFL drew 462,159 fans across 43 games in 2026. That works out to 10,748 per game. The number sits inside the 10,000 to 15,000 range co-owner Mike Repole set as the target. It also hides a spread of 17,556 fans between the league's best market and its worst.
St. Louis averaged 23,239 per home game. Houston averaged 5,683. Six weeks after the season ended, the league cut Houston and Birmingham. This is the record those decisions were made from.
The Headline Numbers
Measure | Figure |
|---|---|
Total attendance, 43 games | 462,159 |
Full-season average | 10,748 |
Regular season, 40 games | 418,708 |
Regular-season average | 10,468 |
Playoffs, 3 games | 43,451 |
Playoff average | 14,484 |
Highest single game | 31,191 (St. Louis, Week 1) |
Lowest single game | 4,001 (Fort Hood, Week 8) |
Games at or above 10,000 | 16 of 40 (40 percent) |
Games below 6,000 | 9 of 40 (22 percent) |
The Fort Hood game was a free-admission military appreciation event at Phantom Warrior Stadium with a capacity near 5,000. Excluding it, the 42-game average is 10,909 and the lowest figure of the season is Houston's 4,409 in Week 7.
Every Regular-Season Game
Weeks 1 Through 5
Week | Game | Venue | Attendance |
|---|---|---|---|
1 | DC at St. Louis | The Dome at America's Center | 31,191 |
1 | Birmingham at Louisville | Lynn Family Stadium | 14,034 |
1 | Columbus at Orlando | Inter&Co Stadium | 11,127 |
1 | Houston at Dallas | Toyota Stadium | 8,870 |
2 | DC at Columbus | Historic Crew Stadium | 14,810 |
2 | Louisville at Orlando | Inter&Co Stadium | 8,585 |
2 | Birmingham at Houston | Shell Energy Stadium | 7,744 |
2 | St. Louis at Dallas | Toyota Stadium | 5,799 |
3 | Birmingham at St. Louis | The Dome at America's Center | 20,209 |
3 | Houston at DC | Audi Field | 12,167 |
3 | Orlando at Louisville | Lynn Family Stadium | 11,082 |
3 | Columbus at Dallas | Toyota Stadium | 5,133 |
4 | Orlando at Birmingham | Protective Stadium | 18,340 |
4 | Dallas at Columbus | Historic Crew Stadium | 8,729 |
4 | St. Louis at DC | Audi Field | 7,940 |
4 | Louisville at Houston | Shell Energy Stadium | 4,880 |
5 | St. Louis at Orlando | Inter&Co Stadium | 9,735 |
5 | DC at Birmingham | Protective Stadium | 8,120 |
5 | Louisville at Dallas | Toyota Stadium | 7,123 |
5 | Columbus at Houston | Shell Energy Stadium | 5,166 |
Weeks 6 Through 10
Week | Game | Venue | Attendance |
|---|---|---|---|
6 | St. Louis at Louisville | Lynn Family Stadium | 10,456 |
6 | Houston at Columbus | Historic Crew Stadium | 8,347 |
6 | Birmingham at Orlando | Inter&Co Stadium | 9,107 |
6 | Dallas at DC | Audi Field | 7,019 |
7 | Columbus at St. Louis | The Dome at America's Center | 18,563 |
7 | Louisville at DC | Audi Field | 7,950 |
7 | Dallas at Birmingham | Protective Stadium | 4,705 |
7 | Orlando at Houston | Shell Energy Stadium | 4,409 |
8 | Houston at St. Louis | The Dome at America's Center | 21,609 |
8 | DC at Louisville | Lynn Family Stadium | 10,025 |
8 | Columbus at Birmingham | Protective Stadium | 4,824 |
8 | Orlando at Dallas | Phantom Warrior Stadium (Fort Hood) | 4,001 |
9 | Orlando at DC | Inter&Co Stadium | 10,594 |
9 | Dallas at Louisville | Lynn Family Stadium | 10,378 |
9 | Birmingham at Columbus | Historic Crew Stadium | 9,217 |
9 | St. Louis at Houston | Shell Energy Stadium | 6,217 |
10 | Dallas at St. Louis | The Dome at America's Center | 24,621 |
10 | Louisville at Columbus | Historic Crew Stadium | 10,705 |
10 | Orlando at DC | Audi Field | 9,924 |
10 | Houston at Birmingham | Protective Stadium | 5,253 |
Weekly Totals
Week | Total | Average | Highest | Lowest |
|---|---|---|---|---|
1 | 65,222 | 16,305 | St. Louis (31,191) | Dallas (8,870) |
2 | 36,938 | 9,235 | Columbus (14,810) | Dallas (5,799) |
3 | 48,591 | 12,148 | St. Louis (20,209) | Dallas (5,133) |
4 | 39,889 | 9,972 | Birmingham (18,340) | Houston (4,880) |
5 | 30,144 | 7,536 | Orlando (9,735) | Houston (5,166) |
6 | 34,929 | 8,732 | Louisville (10,456) | DC (7,019) |
7 | 35,627 | 8,907 | St. Louis (18,563) | Houston (4,409) |
8 | 40,459 | 10,115 | St. Louis (21,609) | Dallas (4,001) |
9 | 36,406 | 9,102 | Orlando (10,594) | Houston (6,217) |
10 | 50,503 | 12,626 | St. Louis (24,621) | Birmingham (5,253) |
Total | 418,708 | 10,468 |
Week 1 posted the highest average of the season at 16,305. Week 5 posted the lowest at 7,536. The four weeks with a St. Louis home game — 1, 3, 7, 8, and 10 — produced five of the six highest weekly totals.
Team-by-Team Home Attendance
Rank | Team | Home Total | Average | Game-by-Game |
|---|---|---|---|---|
1 | St. Louis Battlehawks | 116,193 | 23,239 | 31,191 / 20,209 / 18,563 / 21,609 / 24,621 |
2 | Louisville Kings | 55,975 | 11,195 | 14,034 / 11,082 / 10,456 / 10,025 / 10,378 |
3 | 51,808 | 10,362 | 14,810 / 8,729 / 8,347 / 9,217 / 10,705 | |
4 | Orlando Storm | 49,148 | 9,830 | 11,127 / 8,585 / 9,735 / 9,107 / 10,594 |
5 | DC Defenders | 45,000 | 9,000 | 12,167 / 7,940 / 7,019 / 7,950 / 9,924 |
6 | 41,242 | 8,248 | 18,340 / 8,120 / 4,705 / 4,824 / 5,253 | |
7 | Dallas Renegades | 30,926 | 6,185 | 8,870 / 5,799 / 5,133 / 7,123 / 4,001 |
8 | Houston Gamblers | 28,416 | 5,683 | 7,744 / 4,880 / 5,166 / 4,409 / 6,217 |
Each team played five home games. Dallas played its fifth at Fort Hood rather than Toyota Stadium. Across the four Toyota Stadium dates, Dallas averaged 6,731.
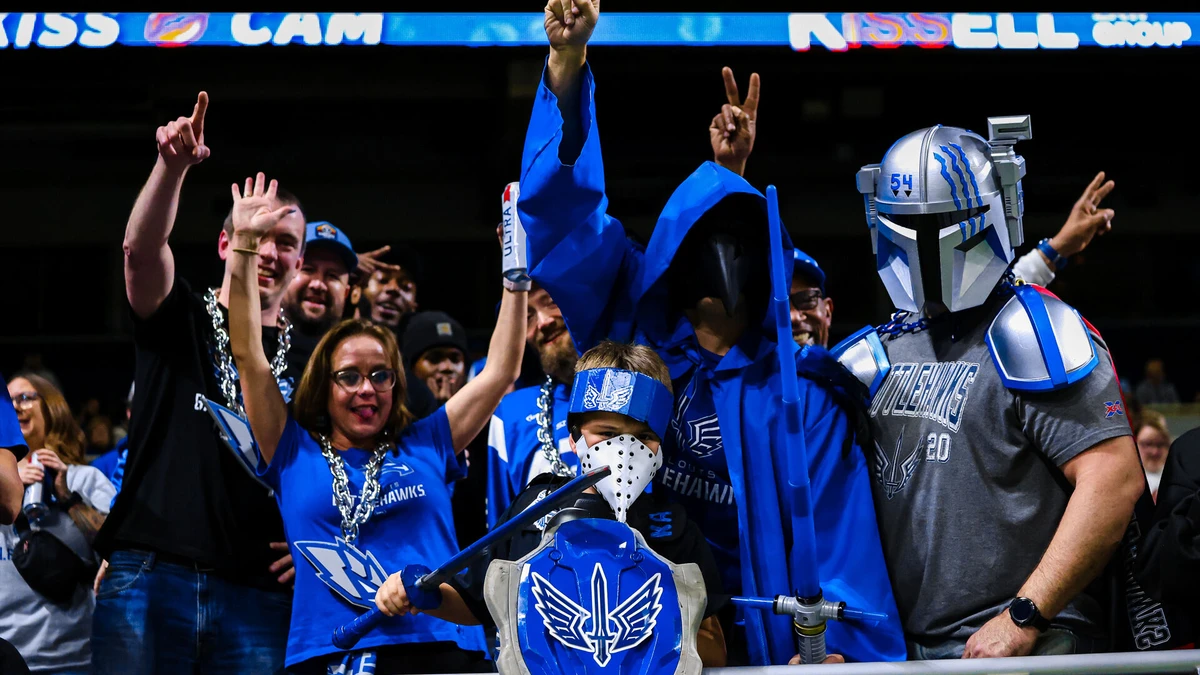
St. Louis accounted for 116,193 of the 418,708 regular-season total, or 27.8 percent. Remove the Battlehawks and the other 35 games averaged 8,643.
Dallas and Houston combined for 59,342 fans across 10 home games, an average of 5,934. St. Louis drew nearly twice that in five.
Fill Rate: The Number Behind the Cuts
Raw attendance tells one story. The share of the building filled tells another, and it maps almost exactly onto the offseason decisions.
Team | Home Average | Venue Capacity | Fill Rate |
|---|---|---|---|
Louisville | 11,195 | 11,700 | 96% |
Columbus | 10,362 | 20,000 | 52% |
DC | 9,000 | 20,000 | 45% |
Orlando | 9,830 | 25,500 | 39% |
St. Louis | 23,239 | ~65,000 | 36% |
Dallas | 6,185 | 20,500 | 30% |
Houston | 5,683 | 20,600 | 28% |
Birmingham | 8,248 | 47,100 | 18% |
Louisville filled 96 percent of Lynn Family Stadium across five home games. No other team cleared 55 percent.
Birmingham filled 18 percent of Protective Stadium. The Stallions out-drew Dallas and Houston in raw numbers and still finished last in fill rate, because the building holds 47,100.
Repole spent the year describing that exact problem. At the October 2025 announcement of the league's new markets he put it in plain numbers: "When you put 12–15,000 in a stadium that fits 60–70,000 it's empty. When you put 12,000–15,000 in a stadium that seats 25,000, it looks packed."
St. Louis and Birmingham both play in oversized buildings. St. Louis fills its lower bowl with 23,239 fans. Birmingham did not.
Birmingham: The Opener Carried the Season
Birmingham's five home games averaged 8,248. One game produced 44 percent of that total.
Game | Opponent | Attendance |
|---|---|---|
Week 4 | Orlando | 18,340 |
Week 5 | DC | 8,120 |
Week 7 | Dallas | 4,705 |
Week 8 | Columbus | 4,824 |
Week 10 | Houston | 5,253 |
The Week 4 home opener paired with a Gucci Mane halftime performance. The four home games after it averaged 5,726. The drop from 18,340 to 8,120 in a single week was the steepest week-over-week home decline of any market in 2026.
Houston: No Game Above 8,000
Houston never cracked 8,000 in any home game. The Gamblers rebranded from the Roughnecks name and moved to Shell Energy Stadium for 2026. Neither change moved the gate.
Game | Opponent | Attendance |
|---|---|---|
Week 2 | Birmingham | 7,744 |
Week 4 | Louisville | 4,880 |
Week 5 | Columbus | 5,166 |
Week 7 | Orlando | 4,409 |
Week 9 | St. Louis | 6,217 |
The 5,683 average was the lowest of any team in 2026.
DC: Winning Did Not Fill the Building
DC held the league's best record at 5-1 through six weeks and averaged 9,000 at home. The Defenders drew 13,000 per game in 2025. The 2026 figure is a 31 percent decline.
The Week 6 game against Dallas drew 7,019 with a Washington Nationals game across the street at Nationals Park starting at 4 p.m. Most fans reach both venues by Metro, and the later baseball start meant fans could attend both.
Dallas showed the same pattern in reverse. The Renegades started 3-0 and drew 5,133 in Week 3, their lowest Toyota Stadium figure of the season.
The Playoffs
Game | Venue | Attendance | Result |
|---|---|---|---|
Semifinal: DC at Orlando | Daytona Stadium, Daytona Beach | 6,317 | DC 28, Orlando 22 |
Semifinal: Louisville at St. Louis | The Dome at America's Center | 18,111 | Louisville 29, St. Louis 20 |
United Bowl: Louisville vs. DC | Audi Field | 19,023 | Louisville 27, DC 20 |
Total | 43,451 |
Orlando earned the No. 1 seed but did not play at home. Inter&Co Stadium was booked for a pre-World Cup friendly between England and Costa Rica on June 10. The league announced Historic Crew Stadium in Columbus on May 29, then moved the game to Daytona Stadium on June 1, six days before kickoff. Daytona Beach sits about 50 miles from Orlando.
The United Bowl sold out at Audi Field. The league opened the upper deck for the first time all season to meet demand. The 19,023 figure is more than double DC's regular-season home average.
Three-Year Playoff Comparison
Season | Semifinal 1 | Semifinal 2 | Championship | Total | Average |
|---|---|---|---|---|---|
2024 | 10,287 | 30,237 | 27,396 | 67,920 | 22,640 |
2025 | 10,928 | 27,589 | 14,559 | 53,076 | 17,692 |
2026 | 6,317 | 18,111 | 19,023 | 43,451 | 14,484 |
Playoff totals have declined each season. The championship game reversed direction in 2026, rising from 14,559 to 19,023 after moving out of St. Louis to a 20,000-seat building that sold out.
St. Louis playoff attendance has fallen each year: 30,237 in 2024, 27,589 in 2025, 18,111 in 2026. All three games were at The Dome.
What the Season Produced
Six of eight teams played in venues under 26,000 in 2026, up from the college stadiums and domes the league used in 2024 and 2025. The full-season average landed at 10,748.
Four things the data shows:
The strategy worked where the building fit the market. Louisville drew 11,195 per game in an 11,700-seat stadium and won the championship in its first season. That is the model.
It did not work where the building stayed oversized. Birmingham at 47,100 and St. Louis at roughly 65,000 both ran well under half full. St. Louis draws enough fans to absorb it. Birmingham did not.
Downsizing alone does not fix a market. Dallas moved into Toyota Stadium at 20,500 and averaged 6,731 there. Houston moved to Shell Energy Stadium at 20,600 and averaged 5,683. Both buildings sit inside Repole's stated range. Neither market responded.
Winning does not move the gate. Dallas started 3-0 and posted its lowest home number in Week 3. DC held the best record in the league and declined in three straight home games. Orlando finished 8-2 and averaged 9,830.
What It Meant for 2027
The UFL announced on July 30 that Birmingham and Houston are out for 2027 and that two markets replace them. Repole's stated reason for Birmingham was the venue: "With Birmingham, this decision was 100% due to the wrong sized venue."
The attendance record supports that read. Birmingham finished sixth in raw home average and last in fill rate. Houston finished last in both.
The league release lists three tests for a market: the right market, the right sized venue, and a passionate fan base. Louisville cleared all three in year one. That is the standard the two replacement markets will be measured against.